Demand Response: 101
A deep dive into what demand response is, why it's important, and how much it is worth.
14 minute read ∙ Apr 22nd, 2020
Demand Response, also called load shifting, means actively reducing power consumption in response to grid conditions.
Why would we do this?
Simply stated, Demand Response reduces the cost to provide electricity. Demand Response makes the power grid more efficient, and ultimately lowers the cost of providing power. This is a valuable service that grid operators are willing to pay for.
If you are completely new to the power industry, you would benefit from reviewing some more basic posts before reading this:
Why Does Demand Response Matter?
Discussions about avoiding congestion bring rush hour to mind: you'd prefer not to ride the train or drive on the freeway at peak times. When it comes to the power grid, though, we typically don't think about it. When you flip a switch, your light comes on - regardless of what time of day or day of the week it is. But, behind the scenes, there is a cost: power consumption costs more to provide during peak times. At worst, power supply falls short of demand, and people will lose power. Most systems have a lot of spare capacity in reserve (>10%) to avoid just that; this capacity sits and waits for those peaks or a grid emergency like a power plant shutting down unexpectedly, when it will be tapped to back up the grid.
A load duration curve helps visualize this - it shows what demand (in GW) is for how many hours of the year. On the left side is the peak (infrequent demand), while the right shows constant baseload demand. This example from MISO shows their load duration curve for the summer. At its further right point, MISO's load duration line remains above 50GW (on the y axis). This means their load is always above 50GW - so that is the minimum generation required at all times. At the far left, you can see their peak load; 120GW of power are required for just a few hours of the year vs <110GW for the rest of it. This may not seem like a big spike in consumption, but the scale is huge - 1 GW is equivalent to over 100,000 residential A/C units!
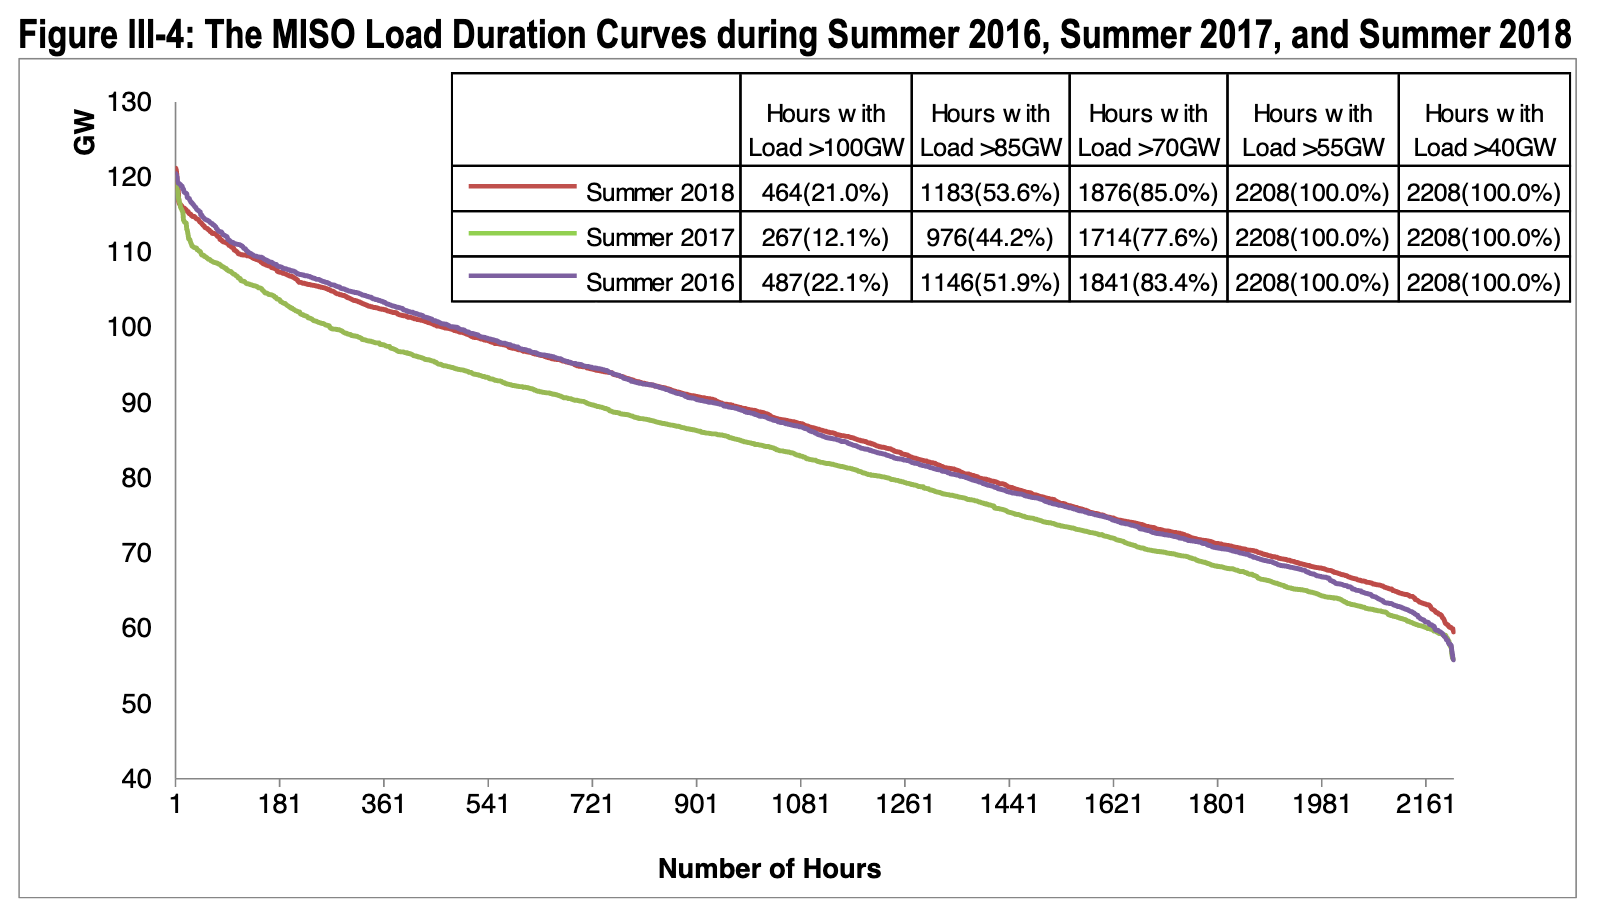
Historically, demand has been accepted as a given, and utilities have been responsible for making sure they can meet that demand by building enough generation and transmission to support it. But this leads to a lot of expensive overbuild - Gigawatts of power plants (and billions of dollars of power line investments) are built only to serve peak demand for a few hours a year. Alternatively, it would be cheaper to pay customers to sometimes reduce their consumption.
A brief overview of Demand Response
To understand what Demand Response (DR) is today, it's helpful to understand what it has been. DR has been around for a long time. It has historically been "interruptible load" - essentially, shutting down select demand in severe grid emergencies. In practice, this could mean a large manufacturer or two have given a utility permission ahead of time to cut off their power in very dire situations (in return for financial incentives). This could happen 2-3 times a year, but grid operators would consider it a success if they never had to call on it. This would mean the grid performed as expected and there were no "emergencies".
This type of emergency option is still valuable, but load shifting capabilities have grown beyond this and have yet to be fully tapped. This is due to changes in capabilities on both the supply and the demand side. On the supply side, the rise of renewable energy has provided some urgency to getting more out of flexible demand. Grid operators can't ramp up renewable energy production when they see a spike in demand - renewable energy can be forecasted, but you can't control when the sun shines and wind blows. This means that storing energy (using batteries) and shifting demand to better align with production becomes more needed. Simultaneously, on the demand side, a whole host of devices are coming online with internet connectivity. This type of connectivity makes load shifting easier to implement, both flexibly and at scale.
This changing environment means the term "interruptible load" is too simplistic to describe Demand Response today. It is usually called load shifting, Demand Response or, when combined with energy efficiency, demand side management. Some people are trying to make flexiwatts happen - stay tuned on that one.
As we tap into more and more uses of Demand Respose, its value increases. This creates a virtuous cycle where more resources will want to participate, and then bring more benefits to the grid. We are currently in a transition period where DR is going from a thing that utilities have to use occasionally (in emergencies) to a dynamic and flexible grid asset.
Despite this trend, one major headwind against DR has always been its incompatibility with the traditional regulated utility business model, in which utilities make money by building infrastructure (poles, wires, power plants) and their shareholders do not benefit by finding cheaper alternatives. To solve this, regulators are finding ways to incentivize utilities to use Demand Response (or often "Non Wires Alternatives") as a way to avoid expensive capital upgrades and save money for everyone.
Visualizing a Demand Response event
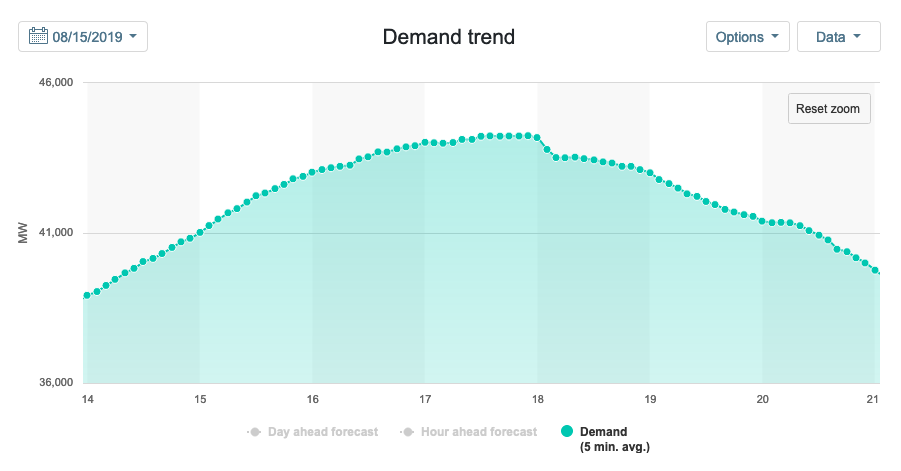
So, in practice, what does this look like? To help illustrate what Demand Response looks like when done successfully, let's take a day last summer in California.
August 15th, 2019, was a hot day in California: many parts of the state were over 100°F. In the evening, Californians returned home and turned on their air conditioning, right when the output of solar power was starting to decrease with the evening sun. California utilities asked their Demand Response aggregators to reduce demand starting at 6pm (18 on the chart), and we saw state-wide demand reduced by almost 1 GW right away, significantly easing the strain on the grid.
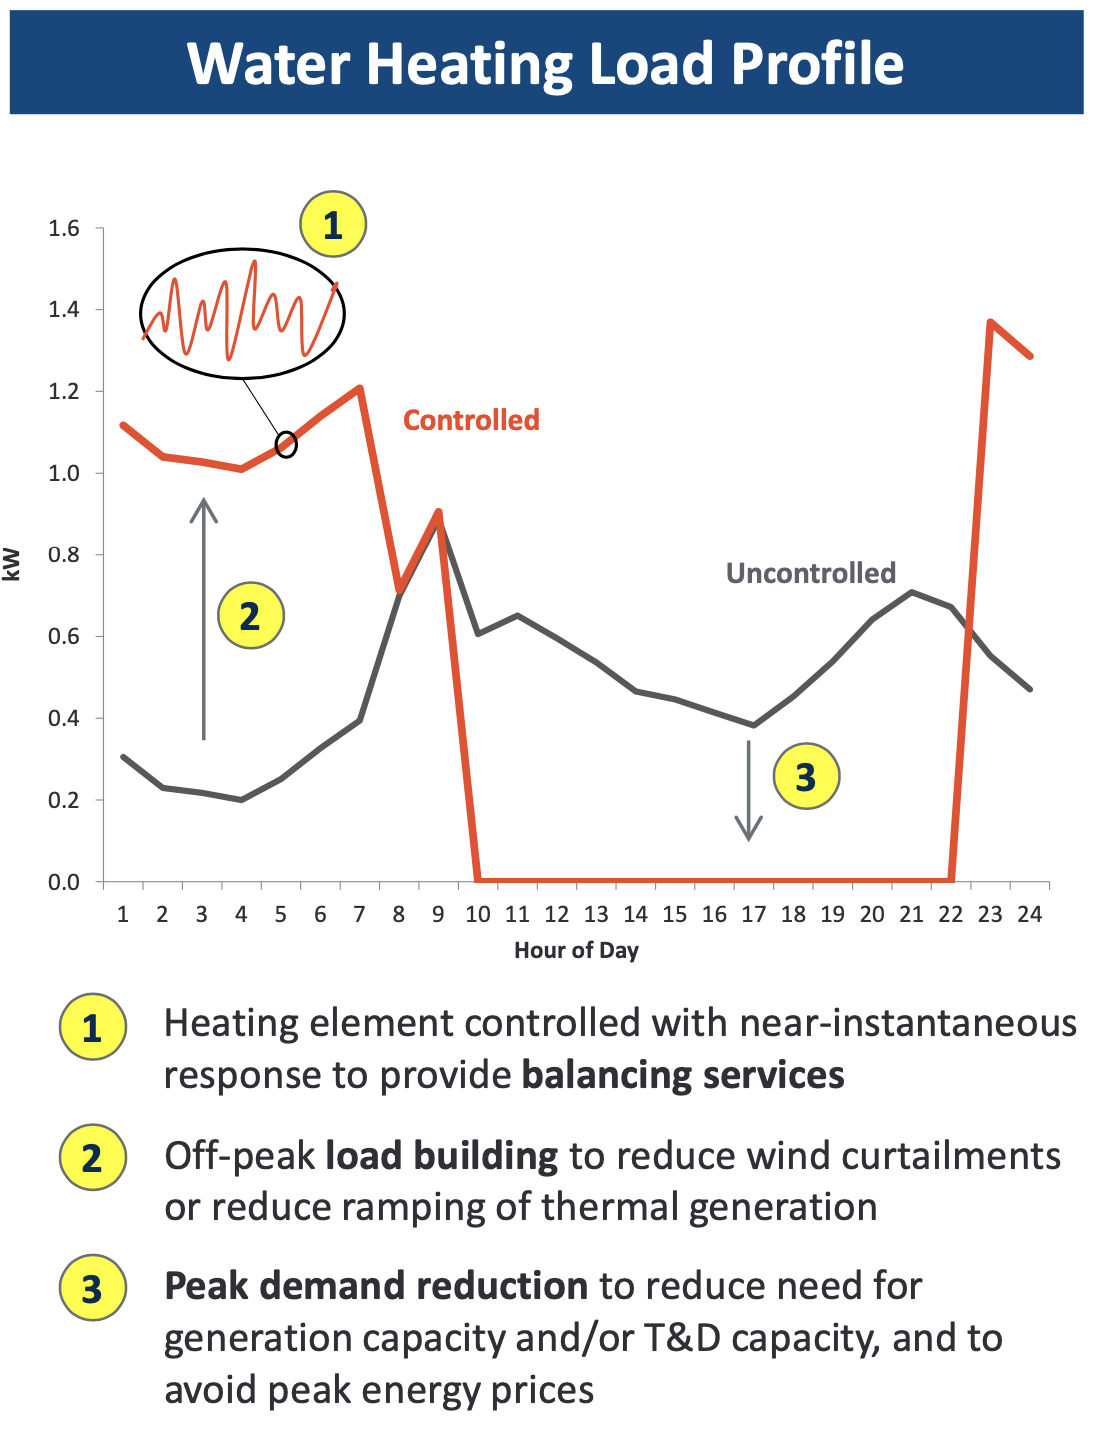
That's what it looks like at a massive scale. For an individual home, or device, it can be much more drastic. Here is a screenshot from a Brattle Group report showing an example of a change in load profile for a water heater in response to grid incentives. To the end customer, they wouldn't notice the difference - hot water would be available when they need it - but their overall energy consumption profile would shift dramatically.
What is Demand Response today?
While a lot of existing Demand Response programs are still the basic "interruptible load", that does not cover the full breadth of what we now consider DR. LBNL has provided the most comprehensive view on all the things we can do with load shifting, and their work is definitely worth a read if you have the time and interest. One key contribution is defining and categorizing the four main types of load shifting: shape, shift, shed and shimmy.
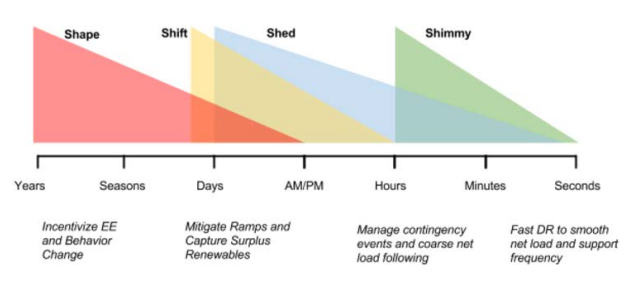
- Shape: re-shaping loads over time using structural means such as pricing signals or long-lasting interventions. This would be a long-term change to a load profile.
- Shift: shifting consumptiom from peak to a lower consumption period, for example using a battery, pre-heating a water heater tank or waiting until night to charge an EV.
- Shed: cutting loads during peak times, such as turning down lighting or turning up a thermostat. This is the closest category to "traditional DR" (shift is also similar).
- Shimmy: minute by minute shift to help with load balancing services such as frequency regulation or mitigating disturbances in time frames of minutes or even seconds.
"Shape, Shift, Shed and Shimmy" is a useful framework to conceptually grasp DR. To fully understand how these concepts work in practice, it is helpful to walk through different categories and tactical examples of how DR programs are used today.
Classic Demand Response - Capacity Bidding
This is what is most often thought of as Demand Response - essentially, paying customers to cut load at specific times. Some examples of what this could look like:
- A large industrial customer is paid by the ISO to agree to turn off their pumps in an emergency event, which may happen 2-3x a year or once every few years. This is "classic DR". See: EnelX (formerly EnerNOC) Demand Response offering
- A manufacturer of residential smart thermostats offers to sign up their customers in a utility territory and reduce consumption during peak events. The utility pays the device manufacturer for providing the service, and pays the homeowners for participating (usually a ~20/80 split). See: Nest rush hour rewards
- A commercial building energy manager determines how much load they can shed during peak hours, and bids that into a utility program. They program their building management system to receive automated messages from the utility and cut load. See: Hawaiian electric FastDR
- A behavioral DR aggregator pays homeowners directly to reduce load however they can. They may text or email them telling them when to reduce load, and it is up to the homeowner to reduce their consumption. The aggregator is paid by the utility for all the capacity reduced by participating homeowners. See: Ohmconnect
There are many different versions of this, but the common thread is that the load serving entity (utility, ISO, CCA, etc) is explicitly paying for customers to reduce their consumption during critical hours. There is usually an aggregator who plays a facilitating role in exchange for a portion of the incentive payments (and sometimes multiple aggregators). The benefit of this approach is that utilities get more control and more insight into how much they can cut, but it is also more hands on.
Pricing signals
Changing pricing is a more passive way to shift load - this aligns more closely to shape in LBNLs 4s taxonomy shared above. Utilities usually don't directly control load, so they have to get the pricing incentives right, but if they do it properly this can be a very efficient way to align incentives and make the grid more efficient. This is important to consider because even in situations where there isn't a traditional demand response program, end customers on some sort of variable rate plan can still save a lot of money by implementing load shifting. Some companies offer this as a service to customers, such as Evolve Energy in residential and Extensible Energy for Commercial buildings.
Examples of pricing signals include:
- Time of use (TOU) pricing: multiple pricing tiers that are higher during peak times and lower in off-peak times. As of 2020, all Californians will be on time of use pricing by default.
- Critical peak pricing (CPP): similar to a TOU program but based on a few peak days each year vs peak times of day.
- Demand charges: common in commercial & industrial settings - on top of paying for power consumed, the customer pays a monthly or yearly fee based on the maximum amount of consumption at any given point. Often these can make up over half of the total utility bill, giving these kinds of customers a strong incentive to reduce their overall peak. A corrolary of these are interconnection fees, which are increasingly (and contentiously) levied on customers with rooftop solar.
- Real time pricing: the wholesale price of power varies based on supply and demand. Most of the time customers are insulated from that by their utility, but on real time pricing plans they are directly exposed to wholesale prices and therefore have a natural incentive to save energy when prices are high.
Texas has the most market-driven approach in North America, and makes extensive use of pricing to shape behavior. There, wholesale power prices average perhaps $0.1-0.15 / kWh. However, during the hottest time of year demand is very high and prices spike, up to a maximum of $9 / kWh. A large residential home can use >10 kWh per hour during a heat wave and burn through $100s in those few hours alone. As a result, consumers who are exposed to real time pricing don't need any additional incentive to shift their consumption. The potential downside to pure price signals is the fear of customer shock and subsequent blow-back after they get hit with a massive bill for just a few hours of energy consumption in the summer. They might be an excellent choice for sophisticated customers like commercial, but will be harder for mass market residential customers, who may benefit from a more explicit, contract-driven approach.
Energy Efficiency (EE)
Almost all energy efficiency measures have an impact on peak demand, therefore they can be thought of also as Demand Response measures (again, they would fit under shape in LBNL's taxonomy). For example, swapping out an inefficient A/C unit that uses 10 KW for an efficient one that uses 7 kW will reduce peak load permanently by 3 kW. Depending on how it is funded and measured, it may be more or less effective than other DR measures, and a combination of the two (sometimes called integrated demand side management) can be very cost-effective. An example of this would be swapping out a "dumb" electric water heater with an efficient and "smart" heat pump water heater, which will both lower overall consumption as well as make it easy to shift consumption based on time.
How to value Demand Response?
The simple answer is, as always, it is worth what someone will pay for it. In some parts of the country and the world, there is simply not a willing buyer - the utility is not running a DR program or the customer is not on variable rates - so while there is theoretical value, there is not yet achievable value. However in areas where there is a DR market, we can get a sense of value by using published prices from DR projects.
Demand response is usually valued in $ / kW-year. kW-year refers to the capacity curtailed during a DR event, valued over the course of a year. It can also be kW-month or kW-day, or is sometimes paid in energy payments of kWh shed during the event.
| Program | $ / kW-yr | Source |
|---|---|---|
| PG&E Capacity Bidding | 62 | link |
| SCE Capacity Bidding | 66-75 | link |
| PJM | ~20-50 (in 2018) | link |
| Hawaiian Electric | 60-120+ | link |
| MISO | ~25 | link |
| ISO-NE | ~35-70 | link |
As you can see, the range varies, but tends to be in the $25-75 / kW-yr range. On the cheaper end are the ISO programs, which are more generally mass market, interruptible load programs that don't call on their resources a lot. On the upper end are programs that call many events a year and get more value out of the resources.
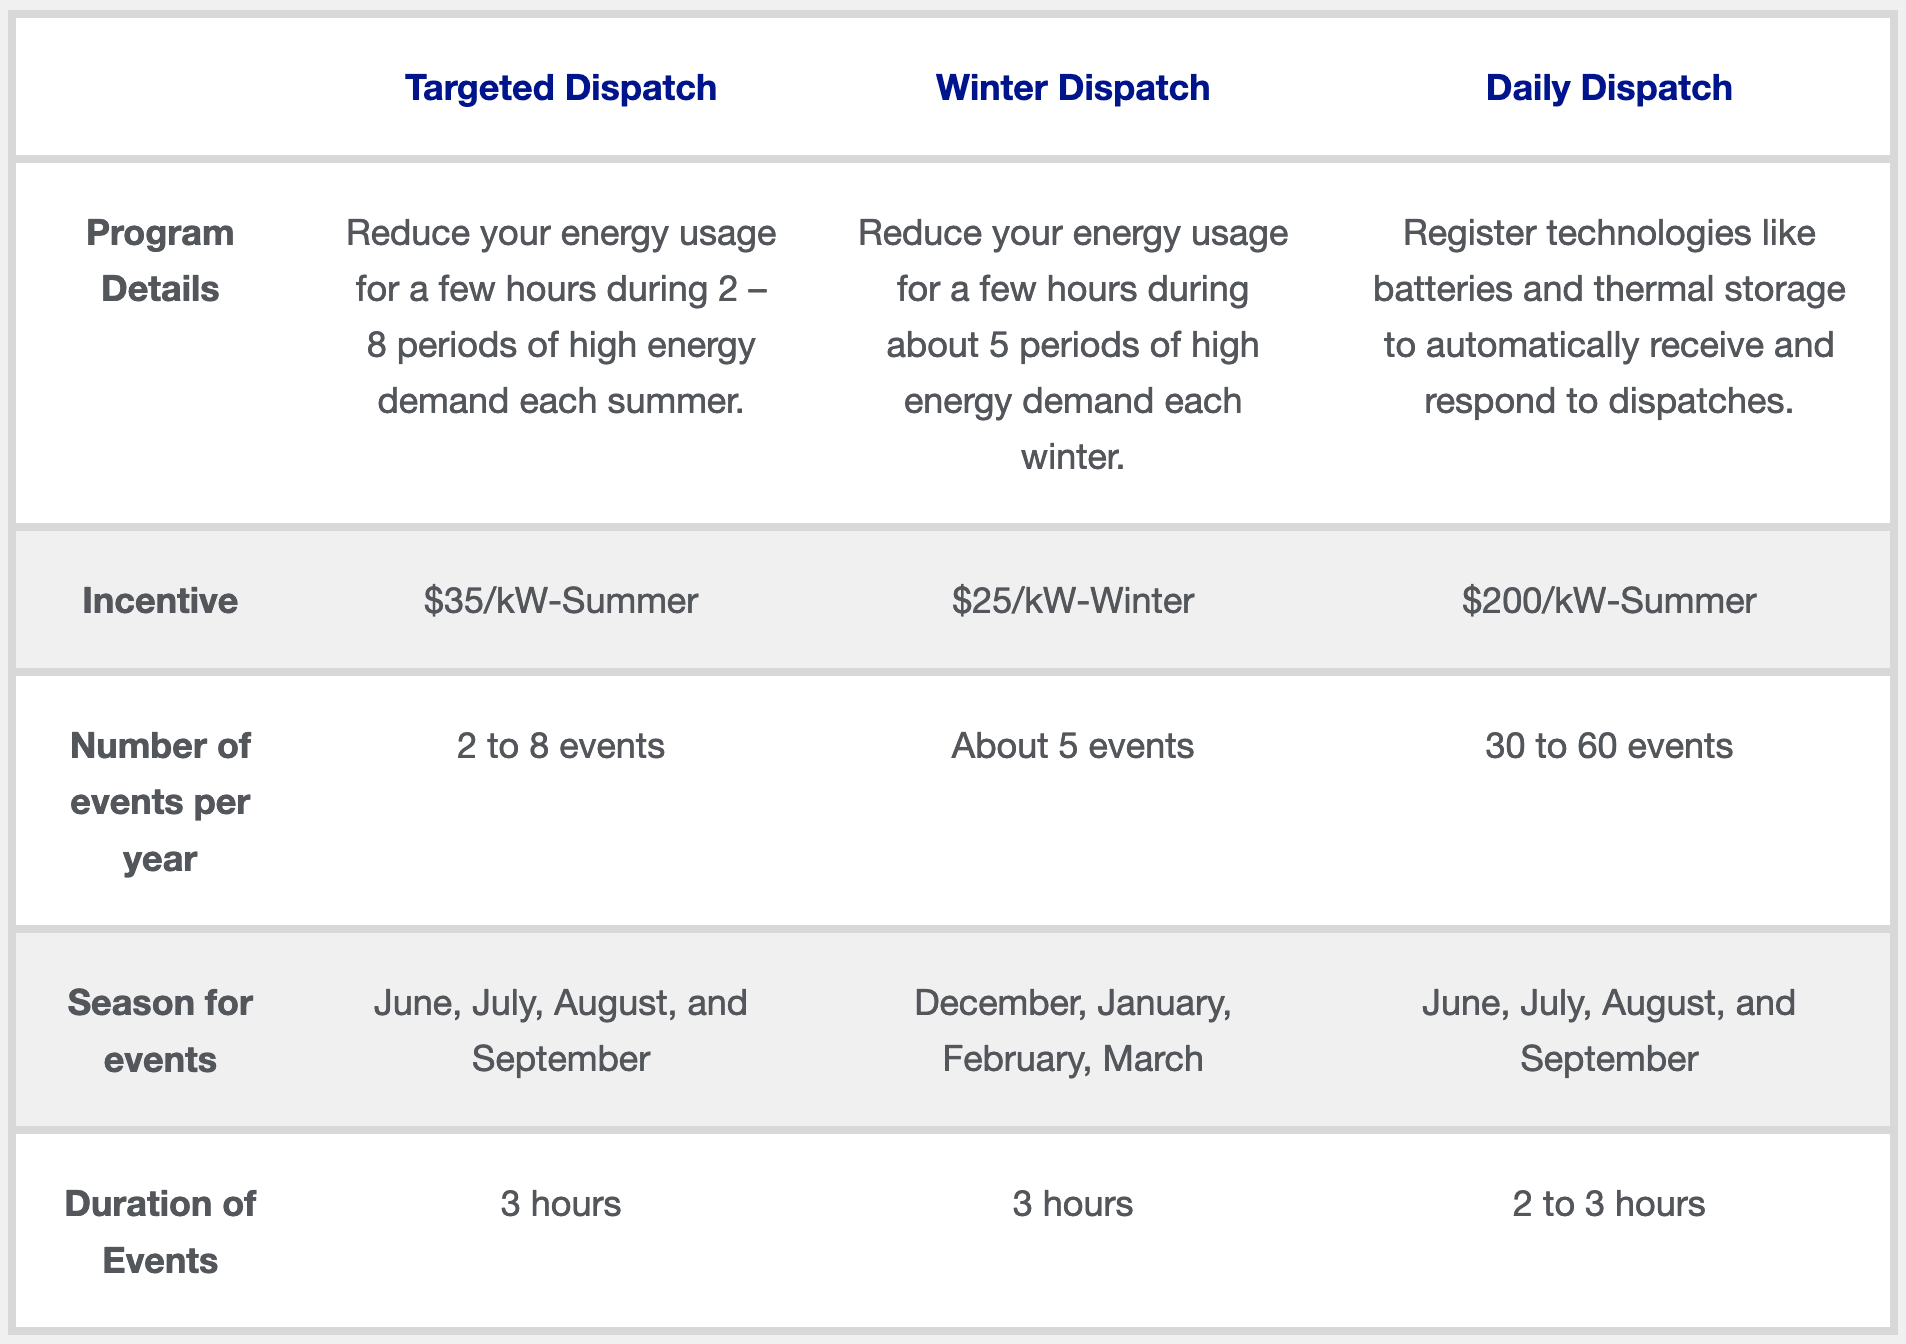
We can see this effect starkly in National Grid's Connected Solutions programs (as of 2020). They have a one program that pays $35 / kW for the summer, and another program (Daily Dispatch) that pays $200 / kW for the summer. The obvious differences are that the Daily Dispatch program is automated, so more controllable for the utility, and called much more often. This gets more value out of the load shifting capability.
The value of demand response will continue to increase if utilities are willing to pay more for valuable services, such as frequency regulation, more frequent load shifting, value stacking multiple services, and more.
How do you measure Demand Response?
How do you measure the absence of consumption? This is a crux of DR, as you can never truly know how much you produced, you can just use a best estimate. The key is to create a baseline: how much would you have used under normal circumstances, and compare that to how much you actually used. This seems like a simple enough solution, but there are enough complicating factors that there is not a standardized approach today.
Many regions use a simple measurement to determine a customers' hourly consumption baseline, for example: the average of consumption from the last 10 similar days (i.e. weekdays). Sometimes they also add a day-of adjustment, e.g. if overall consumption on the event day is higher than the last 10 day average, increase the baseline by that amount. This sounds simplistic, but the benefit it is easily understood and calculatable by anyone. Using complex models can be more accurate, but also easier for end customers to question if they are unhappy with their result as they are often a black box.
A company called Recurve is attempting to address this with an open source, regression based model, as they explain in this article. That way anyone can see the calculation methodology, but it is also more sophisticated (and presumably accurate) than a simple last-10-days approach. When the measurement problem is "solved" (most would say it already is), that will remove a barrier to demand response being realized as a grid resource.
How big is the market?
According to the SEPA demand response snapshot, there is approximately 20GW of Demand Response capacity enrolled today in the US. That implies a market size of approximately $1-1.5Bn / year. This estimate is probably low, because it limited to just the respondents of their survey: others have estimated it at 60 GW. Either way, there is plenty of room to grow.
The Brattle group did a study in 2019, The national potential for load flexibility, that estimated a potential of 200 GW of cost effective load flexibility potential, with benefits of >$15Bn / year (implying a value of $75/kW-yr) by 2030. The majority of this will come from avoided generation capacity (not having to build new power plants), followed by avoided energy costs. Avoided grid modernization costs (poles & wires upgrades) and ancillary services make up another ~20% of the value.
However, they note that the relative value of each service will vary significantly from region to region. A stark example of this is shown in the LBNL Demand Response potential study. They calculate that, while the average value of DR to the T&D system is only $25/kW-year (unsurprising, given the small portion of the overall value calculated by Brattle Group), in the top 5% of areas with localized grid constraints, it can top $160-300/kW-year. So, finding those 5% of areas would lead to very high value DR projects and probably good candidates for Non Wires Alternatives.
In Summary
After spending many decades as an interruptible load tool, Demand Response is poised for very dynamic growth in both use and value. In other words, the ability to shift load is valuable, and getting more so. If you have this valuable capability or can create it, you should go out into the market and provide it as a service to the grid. You'll help make the grid more efficient, integrate more renewable energy, and make a lot of money doing it. Good luck!
Interested in learning more?
Sign up for our quarterly(ish) newsletter with industry & protocol news, commentary and product updates.
Or if you'd like to discuss, contact us